So, I’ve been trying to get some test results together over the last few weeks to try to determine why our Tinderboxes keep going orange. To do that, I’ve been running the TUnit test harnesses constantly on the same change set, amassing quite a bit of data. One of the things I’d like to be able to do here would be to determine why we get these random failures and how we can minimize them. I’ve almost acquired my first set of full results, and to complement the investigation into each failure, I’d like to have a set of metrics I could apply to the entire run as a whole so that I could measure a couple of things.
- Measure the reliability of each test harness in the TUnit suite (i.e. XPCSHell, mochitest, mochitest-chrome, mochitest-browser, mochitest-a11y, Reftest, Crashtest).
- Measure how close my machines match that of Tinderbox in terms of random failures they encounter
- Measure how random each failure is.
So, to get each of these, I’ve come up with an idea on how to calculate them. However, I’m no math whiz, and that’s why I turn to you to get your opinion before I start crunching numbers. Here are my thoughts on how to measure this stuff. I apologize in advance for the copies straight from my notes, I wanted to get feedback before spending time on making it extremely pretty. I’ll do MathML next time, especially if these prove to be illegible.
Reliability of each Harness
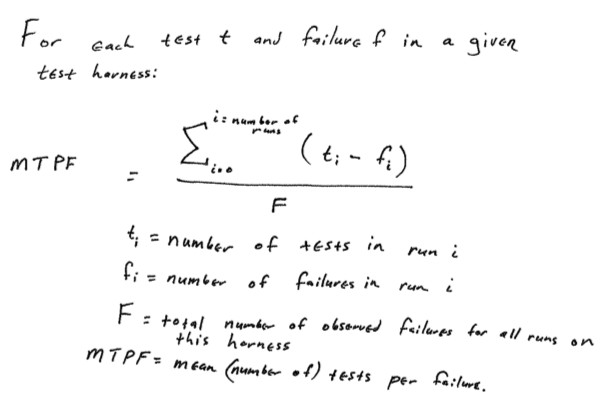
To do this, I’m basing my analysis off the standard Mean Time Between Failure metric. Here, it would be more aptly called mean tests per failure. In other words, how many tests do we run before we hit a failure on a given test harness.

Mean Tests Per Failure from my notes
Here, my idea is to sum the delta of the number of tests ran in the harness and the number of failures in those test runs, then divide that by the total number of failures from all runs on this harness. This does seem to make sense on the surface: if there are no failures your number of tests run per failure encountered approaches infinity. If every test fails, the number of tests run per failure encountered approaches zero. One thing that bothers me about this metric is the amount of noise that will be introduced by upgrading to a new changeset – because with a new changeset, we’ll also have a new set of tests in the harness we are testing against.
How close are we to Tinderbox
To do this, I’m going to take a discreet view of the total known failures, both those that are known to be random on tinderbox, and those that I’m encountering:

Percent difference the test machines are from the true Tunit machines
This measurement is across all harnesses. Essentially, the number of items in the set of observed failures on my machines (G) that are not in the set of known random failures on Tinderbox (T), divided by the number of the items in the set of known failures on Tinderbox (T). This will give me a percentage value that indicates how closely we match Tinderbox. If all the tests that fail on my machines are the same tests that are known to fail on tinderbox, then we have a 0% difference. However if more tests fail on my machines than on tinderbox (which is what initial analysis is showing) then we will have a non-zero percentage difference. One caveat here is if less tests fail on my machines (i.e. not all Tinderbox failures are displayed) then I would still have a 0% difference. Since I’m only trying to determine “how different are my machines acting from Tinderbox’s behavior,” I think this might be OK. Thoughts?
Measuring Randomness of a Failure
This is probably the most straightforward measurement that I am considering.

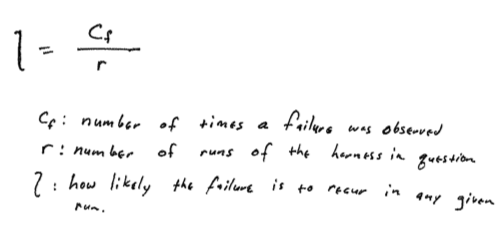
Measurement of how random a given failure is
This is simply the number of times a particular failure occurred (Cf), divided by the number of times we ran that harness (r). This gives a simple percentage of how likely (l) it is that we will observe the failure in question. The reason this calculation can be this simple is that during any given run A we can only hit any given failure X once.
Thoughts?
So, those are my first thoughts on how to measure this data. I have a lot more questions than I have answers:
- I’ve been reading a lot, but it’s been a long time since I’ve done this kind of math — are these correct?
- Are there other metrics that would make sense for this issue? I don’t want to do a bunch of metrics for the sake of numbers, but I definitely want to have a good way to compare the data I get from this effort between runs on different changesets in order to determine if we are making the TUnit test suite more or less reliable.
- Ideas on how to measure the error in this process?
Thanks for the help!


I would
replace frac{abs(G-T)}{T} by frac{sqrt{ (G-T)^2}}{T}
The task sounds like a typical Goodness of fit issue.
(http://stattrek.com/AP-Statistics-4/Goodness-of-Fit.aspx?Tutorial=Stat)
It’d be easier to comment intelligently if I could read the text in those images….
Pingback: John O’Duinn’s Soapbox » Making unittest life better - whats next?